
Iridescence in Metamorphic “Rainbow” Hematite
ABSTRACT
The authors investigated “rainbow” hematite from Minas Gerais, Brazil, using electron microscopy, atomic force microscopy, and synchrotron X-ray diffraction to determine the cause of its intense wide-angle iridescence. The study revealed that the interference is produced by a highly periodic microstructure consisting of spindle-shaped hematite nanocrystals containing minor Al and P impurities. The nanorods are 200–300 nm in length and 50–60 nm in width. They are arranged in three orientations at 120º angles with respect to each other and stacked layer by layer to form the bulk crystal. The distances between adjacent parallel spindle-shaped particles within the same layer fall in the range of 280–400 nm, generating a diffraction grating for visible light. The organized substructure is apparent on all freshly fractured surfaces, suggesting that it represents more than an exterior surface coating. The authors propose that this periodic substructure results from arrested crystal growth by the oriented aggregation of hematite nanorods.
INTRODUCTION
Hematite specimens that frequently display iridescence are described as “rainbow hematite” and “turgite” (figure 1). The latter term originated with the German mineralogist Rudolph Hermann, who coined it in 1844 to describe iron hydroxide specimens found near the Turginsk River in the Ural Mountains (Hermann, 1844). “Turgite” was discredited as a distinct mineral name in the 1920s, however, based on thermogravimetric (Posnjak and Merwin, 1919) and X-ray diffraction (Böhm, 1928; Palache et al., 1944) studies that identified such specimens as mixtures of microcrystalline hematite (Fe2O3) and either goethite (FeOOH) or amorphous Fe hydroxide. Nevertheless, “turgite” has been retained by the mineral collecting and gem community as a catch-all term for naturally iridescent iron (hydr)oxide minerals.

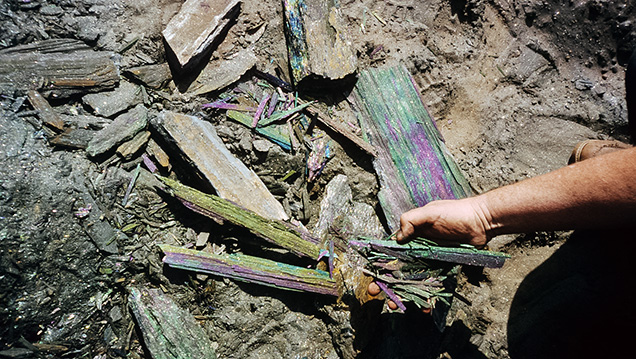
Figure 2. Rock Currier (left) and colleague survey a seam of rainbow hematite at the Andrade mine. Photo © Rock Currier, Mindat.org.
Mineral dealer Rock Currier (1940–2015) was largely responsible for introducing rainbow hematite to the U.S. market. According to notes he published on Mindat.org, Currier first visited an outcrop of what he called “color rock” from the Andrade mine in João Monlevade, Minas Gerais, Brazil, in 1991 (figure 2; Currier, 2012). Shortly after, he shipped a truckload of 55-gallon barrels filled with an estimated 15 tons of the material to the United States. Initially he attempted to sell the rainbow hematite “by the barrel for $3 per pound without very much luck.” At a subsequent Tucson Gem and Mineral Show, however, he “arrived to find some guy had rented a big billboard and was selling the stuff as the latest and greatest metaphysical jewelry item. One guy was backing little pieces of the stuff with obsidian and selling earrings…for $90 a pair.” Fortunately, Currier had kept enough of the rainbow hematite to select higher-grade samples, and he saw brisk sales of individual pieces.
Bulk samples of this Brazilian rainbow hematite are still sold at major mineral and gem shows, but our discussions with dealers indicate a growing scarcity. Currier attempted to purchase more material from the mine, but apparently the major seam of rainbow hematite at Andrade underlies the primary mine haul road, and excavation would have destabilized this conduit to the open pit. Nevertheless, exquisite pieces of rainbow hematite jewelry are still sold online, with accent stones such as amethyst, apatite, sapphire, tourmaline, and tsavorite (figure 3). Moreover, rainbow hematite plays an important role in the local culture. Villages neighboring the city of Belo Horizonte traditionally sprinkle the streets with truckloads of powdered material for festivals, creating an effect that Currier (2012) likened to “standing in a pile of peacock feathers.“
Bulk samples of this Brazilian rainbow hematite are still sold at major mineral and gem shows, but our discussions with dealers indicate a growing scarcity. Currier attempted to purchase more material from the mine, but apparently the major seam of rainbow hematite at Andrade underlies the primary mine haul road, and excavation would have destabilized this conduit to the open pit. Nevertheless, exquisite pieces of rainbow hematite jewelry are still sold online, with accent stones such as amethyst, apatite, sapphire, tourmaline, and tsavorite (figure 3). Moreover, rainbow hematite plays an important role in the local culture. Villages neighboring the city of Belo Horizonte traditionally sprinkle the streets with truckloads of powdered material for festivals, creating an effect that Currier (2012) likened to “standing in a pile of peacock feathers.“
 and ring (right).")
Figure 3. Left: An 18K gold pendant featuring rainbow hematite from Minas Gerais, Brazil, accented with amethyst and apatite. Right: Rainbow Rapture ring in 18K gold with tourmaline, sapphire, and tsavorite. Designs by Judith Anderson. Photos by The Jewelry Experts, Bijoux Extraordinaire, Ltd.
To our knowledge, Ma and Rossman (2003a,b) have performed the only scientific investigation into the cause of iridescence in rainbow hematite, analyzing specimens from Brazil, Mexico, Italy, and several sites in the United States. Their results are also briefly highlighted in Nadin (2007). Using field-emission scanning electron microscopy (FESEM), Ma and Rossman (2003b) reported that their rainbow hematite specimens were coated with a “thin film” of rod-shaped nanocrystals, each measuring 5 to 35 nm in thickness and hundreds of nm in length. These nanocrystals were oriented in three directions, at 120º angles with respect to each other, and formed a grid-like network. The nanocrystals were too small to determine precise chemical compositions, but energy-dispersive spectroscopy (EDS) revealed high concentrations of Al and P in a ratio that varied from 2.2 to 3.8. Ma and Rossman (2003b) noted that “the minute crystals have failed to produce either an X-ray powder diffraction pattern, an electron back-scatter diffraction pattern, or a Raman spectrum.” The study interpreted the rod-like nanocrystals as a new mineral, but a full characterization was not possible with the resolution of the instrumentation.
Over the 15 years since these results were published online, more sophisticated analytical techniques have become available. For the present study, we sought to determine whether iridescence in rainbow hematite arises from thin-film effects involving Al phosphate phases, as earlier researchers hypothesized, or whether a different mechanism is involved. Rainbow effects in minerals are commonly attributed to nanoscale coatings, as in bornite (Buckley and Woods, 1983; Vaughan et al., 1987) and fire obsidian (Ma et al., 2001, 2007). Yet many gem materials (e.g., opal, labradorite, iris agate, and iris quartz) contain modular substructures that create a diffraction grating for visible light and generate rainbow effects (Darragh et al., 1966; Miura and Tomisako, 1978; Heaney and Davis, 1995; Lin and Heaney, 2017). These substructures often yield insights into exotic crystal growth processes that can inspire pathways for the self-assembly of synthetic materials. For the present investigation, we examined rainbow hematite from the Andrade mine using a combination of light optical microscopy, X-ray diffraction (XRD) and Rietveld analysis, FESEM, and atomic force microscopy (AFM).
Over the 15 years since these results were published online, more sophisticated analytical techniques have become available. For the present study, we sought to determine whether iridescence in rainbow hematite arises from thin-film effects involving Al phosphate phases, as earlier researchers hypothesized, or whether a different mechanism is involved. Rainbow effects in minerals are commonly attributed to nanoscale coatings, as in bornite (Buckley and Woods, 1983; Vaughan et al., 1987) and fire obsidian (Ma et al., 2001, 2007). Yet many gem materials (e.g., opal, labradorite, iris agate, and iris quartz) contain modular substructures that create a diffraction grating for visible light and generate rainbow effects (Darragh et al., 1966; Miura and Tomisako, 1978; Heaney and Davis, 1995; Lin and Heaney, 2017). These substructures often yield insights into exotic crystal growth processes that can inspire pathways for the self-assembly of synthetic materials. For the present investigation, we examined rainbow hematite from the Andrade mine using a combination of light optical microscopy, X-ray diffraction (XRD) and Rietveld analysis, FESEM, and atomic force microscopy (AFM).
MATERIALS AND METHODS
Specimen Description. We purchased the iridescent hematite samples used in this study at the 2014 Tucson Gem and Mineral Show from Cinderhill Gems (Meadow Vista, California), who traced the material to Rock Currier’s bulk shipment from Brazil in the 1990s. The specimens we studied appeared identical in macroscopic physical character to those described by Currier (2012). As noted below, the microstructures matched the descriptions for Andrade hematite in Rosière et al. (2001) and Ma and Rossman (2003b). Thus, we concluded that the rainbow hematite in this study indeed derives from the Andrade mine.

Figure 4. (A) Geologic map of the Quadrilátero Ferrífero in the southern portion of the São Francisco Craton (SFC), Brazil. Iridescent hematite derives from the Andrade mine, denoted toward the upper right as MAN. WLSD: Western Low-Strain Domain; EHSD: Eastern High-Strain Domain. IS: Itabira Syncline. From Mendes et al. (2017), as modified from Dorr (1969).
The Andrade iron ore deposit is located in the eastern high-strain domain of the Quadrilátero Ferrífero district (figure 4) in the southern part of the São Francisco Craton of Brazil (de Almeida, 1977). The Quadrilátero Ferrífero (or “Iron Quadrangle”) is so called because the Paleoproterozoic metasediments in the Minas Supergroup exhibit a rectangular arrangement of synclines (Rosière et al., 2001; Rosière and Chemale, 2008). The Caraça, Itabira, Piracicaba, and Sabará groups are four sequences of the Minas Supergroup rocks (Dorr, 1969; Mendes et al., 2017; see figure 5). The iron ore deposits are located within metamorphosed banded-iron formations in the Cauê Formation of the Itabira Group; the Andrade mine is in a contact-metamorphic zone within this formation. The rainbow hematite occurs as iridescent, specular seams oriented parallel to bedding. The material is brittle and fractures into lath-like splinters, but the crystals within the laths have a granoblastic texture, a term used to describe equigranular minerals without sharp crystal faces in metamorphic rocks. Rosière et al. (2001) attribute these textures to post-tectonic deformation and recrystallization.

Figure 5. Stratigraphic column of the Quadrilátero Ferrífero. Rainbow hematite is found within the Cauê banded-iron formation. From Carlos et al. (2014).
The Andrade rainbow hematite seam occurs within a banded-iron formation (BIF) in the Itabira Group (again, see figure 5), which has lent its name to a broad class of metamorphic rocks called itabirites. These are hematitic (rather than mica) schists that formed when the original jasper bands in the BIF recrystallized into distinct layers of macroscopic quartz and hematite (or sometimes magnetite). The hematite schists, from which we infer the rainbow hematite derives, are intergrown within itabirites (Barbour, 1973).
Scanning Electron Microscopy and Energy-Dispersive Spectroscopy. SEM and EDS were used to characterize surface topography and compositional information for the specimen. As iridescence was evident even from freshly fractured surfaces of the Andrade specimen, we removed a flake from one of our specimens and affixed the flake to an SEM mount using carbon fiber tape so that the flat iridescent surface was parallel to the surface of the SEM mount. We used an FEI Nova NanoSEM 600 field emission scanning electron microscope, outfitted with an Oxford Instruments X-Max (Model 51-XMX1105) silicon drift detector used for EDS analysis, in the Materials Characterization Laboratory (MCL) at Pennsylvania State University to examine the iridescent hematite. Nanoscale secondary electron images were obtained at an acceleration voltage of 5 kV and a current of 9 pA. EDS data were processed using the Oxford Instruments NanoAnalysis AZtec software (version 2.4). We chose three different accelerating voltages (20, 10, and 5 kV) to acquire spectra for the same sites.
Atomic Force Microscopy. To obtain high-resolution surface topography, we used a Bruker Icon I AFM (MCL, Pennsylvania State University) in PeakForce Tapping (PFT) mode with the ScanAsyst image optimization technique. In PFT mode, the cantilever is brought in and out of contact with the surface. PFT algorithms can precisely control the instantaneous force interaction, allowing the use of reduced forces in the imaging process. In this way, both fragile probes and samples can be protected without compromising image resolution. ScanAsyst automatically adjusts the appropriate parameters (such as set points, feedback grains, and scan rates) during the scan and continuously monitors image quality. The AFM probe for this analysis was a Bruker ScanAsyst-Air probe, which has a silicon tip on a nitride lever. The front angle of the tip was 15° and the back angle was 25°. For AFM imaging, the peak force set point ranged from 1 to 4 nN and the scan rate was 1 to 0.5 Hz, with 512 data points per line in each scan. NanoScope Analysis software (version 1.50) was used to process the AFM data.
X-Ray Diffraction. Hematite was powdered in an agate mortar and pestle under acetone. Upon drying, the powder was loaded into a 0.7 ID polyimide capillary for X-ray diffraction. Synchrotron X-ray diffraction data were collected at the GeoSoilEnviroCARS (GSECARS) 13-BM-C beamline at the Advanced Photon Source (APS), Argonne National Laboratory (Argonne, Illinois). The X-ray wavelength was 0.8315(4) Å, and the detector-sample distance was 100.469(1) mm. XRD data were collected with a MAR165 CCD camera. The diffraction pattern was integrated into intensity vs. 2θ plots using the Fit2D program with a polarization factor of 0.99 (Hammersley et al., 1996).
Structure Refinement. Rietveld refinement is a technique for determining atomic structures by comparing the misfit between an observed powder X-ray diffraction pattern and a diffraction pattern calculated on the basis of a model crystal structure (Rietveld, 1969). Factors such as unit-cell parameters and atom positions are allowed to refine until the misfit between the observed and calculated patterns is minimized. Because we suspected that the atomic structure of the iridescent hematite from the Andrade mine might deviate from ideal hematite, we applied Rietveld analysis of the synchrotron XRD data to refine the crystal structure. The Rietveld software employed was the EXPGUI interface (Toby, 2001) of the general structure analysis system (GSAS) (Larson and Von Dreele, 1994). To obtain instrumental broadening parameters, we refined the structure of a LaB6 standard using starting parameters from Ning and Flemming (2005). For the hematite refinement, we incorporated the peak profile parameters refined for LaB6, and the initial structure parameters for hematite came from Blake et al. (1966). Using a 2θ range of 11.5° to 37.5° (dhkl = 4.1 Å to 1.3 Å), we refined the background using a cosine Fourier series polynomial with eight profile terms. After the scale factor, background, unit-cell parameter, zero position, and additional profile terms had converged, the atom positions and the Fe occupancy were refined.
RESULTS

Figure 6. Reflected light microscope image of iridescent hematite revealing the granoblastic texture and strong iridescence of a freshly fractured surface. Photo by Xiayang Lin.
Reflected Light Microscopy. Gems & GemologyViewed using reflected light optical microscopy at low magnification, the rainbow hematite sample appeared as a composite of gray hematite platelets with a strong silvery luster, and the platelets varied in diameter from 150 to 250 μm (figure 6). The lenticular to equidimensional texture was consistent with the mosaic granoblastic fabric reported by Rosière et al. (2001). Even when the iridescent Andrade hematite was freshly fractured, all surfaces exhibited intense rainbow colors (figure 6), leading us to interpret the iridescence as a bulk character, or at least as a pervasive character, rather than as the result of a single surface coating.

Figure 7. FESEM images of a freshly fractured iridescent hematite surface, shown with increasing magnification from left to right, reveal that the granoblastic texture of a single hematite grain (left) comprises individual nanocrystals oriented at 120° angles (center and right).
Scanning Electron Microscopy and Atomic Force Microscopy. When the iridescent surfaces of the Andrade hematite platelets from a freshly fractured surface were analyzed at low magnification using SEM, the surface appeared flat and smooth (figure 7). As first described by Ma and Rossman (2003a), however, sub-micron resolution revealed spindle- and rod-shaped nanocrystals arranged with threefold symmetry. The spindle-shaped particles were 200–300 nm in length and 50–60 nm in width. These oriented nanoparticles were reproducibly observable on freshly fractured surfaces, where they occurred as stacked sheets.

Figure 8. AFM images of iridescent hematite from the Andrade mine at low (A) and high (B) magnifications. The scale bar to the right of each image denotes the height relative to a zero-plane on the surface, with lighter colors representing higher elevations. (C) 3D reconstruction of the image in (B) as calculated by NanoScope Analysis software.
Fonte: Gems & Gemology

Nenhum comentário:
Postar um comentário